In this article we will see How to plot US map using python. we will use geopandas library to plot a map of the United States.
What is GeoPandas Library? GeoPandas is an open source project to make working with geospatial data using python. GeoPandas extends the datatypes used by pandas to allow spatial operations on geometric data types.
Table of Contents
Steps to plot USA map in python
- Need to install geometric
- Use Geo data files (shapefiles)
- Reading shapesfiles
- Understanding CRS
- Plotting shape files
Step 1st : Install geopandas library
conda install geopandas
conda install -c conda-forge descartes
Step 2nd : Use Geo data files (shapefiles)
We used shapefile This is combination of 3 separate files with the same file name.
- filename.shp – Shapefile shape format,
- filename.dbf – Shapefile attribute format,
- filename.shx – Shapefile index,
Step 3rd : Reading shapesfiles
First Import the geopandas library and matplotlib for later use.
import matplotlib.pyplot as plt
import geopandas
states = geopandas.read_file('data/usa-states-census-2014.shp')
type(states)
states.head()
Then output like this
STATEFP	STATENS	AFFGEOID	GEOID	STUSPS	NAME	LSAD	ALAND	AWATER	region	geometry
0	06	01779778	0400000US06	06	CA	California	00	403483823181	20483271881	West	MULTIPOLYGON Z (((-118.59397 33.46720 0.00000,…
1	11	01702382	0400000US11	11	DC	District of Columbia	00	158350578	18633500	Northeast	POLYGON Z ((-77.11976 38.93434 0.00000, -77.04…
2	12	00294478	0400000US12	12	FL	Florida	00	138903200855	31407883551	Southeast	MULTIPOLYGON Z (((-81.81169 24.56874 0.00000, …
3	13	01705317	0400000US13	13	GA	Georgia	00	148963503399	4947080103	Southeast	POLYGON Z ((-85.60516 34.98468 0.00000, -85.47…
4	16	01779783	0400000US16	16	ID	Idaho	00	214045425549	2397728105	West	POLYGON Z ((-117.24303 44.39097 0.00000, -117….
Step 4th : Understanding CRS
CRS stand for Coordinate reference systems and use following command line
states.crs
states = states.to_crs("EPSG:3395")
Then output like this :
Name: WGS 84
Axis Info [ellipsoidal]:
- Lat[north]: Geodetic latitude (degree)
- Lon[east]: Geodetic longitude (degree)
Area of Use:
- name: World
- bounds: (-180.0, -90.0, 180.0, 90.0)
Datum: World Geodetic System 1984
- Ellipsoid: WGS 84
- Prime Meridian: Greenwich
Step 5th : Plotting shapefiles
use following plotting commands
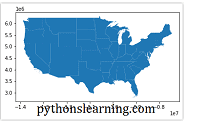
states.plot()
states.boundary.plot()
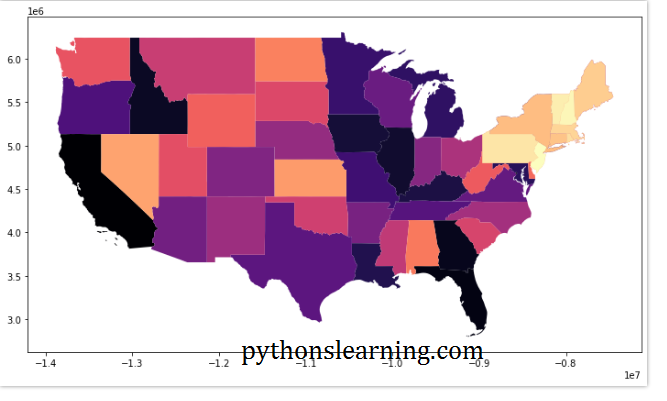
states.plot(cmap='magma', figsize=(12, 12))Final output :
Summary :
In this article we saw How to plot USA map using python so about this article you have any query then free to ask me
Also read :